Tutorial 3: Factorial ANOVA
January 27, 2026
CRITICAL: Regular practice with R and RStudio, the statistical software used in BIOL 322 and introduced during tutorial sessions, and consistent engagement with tutorial exercises are essential for developing strong skills in Biostatistics.
REPORTS/EXERCISES: Tutorial reports are independent exercises and are not submitted for grading; however, students are strongly encouraged to complete them. Some tutorials include solutions at the end to support self-assessment and review. Other tutorials do not require model answers because they are procedural and can be easily self-assessed by verifying that the code runs correctly and produces the expected type of output.
Why Language-Driven Statistical Environments Matter: In this tutorial, you will also recognize why a language-driven statistical environment offers greater flexibility, reproducibility, and scalability (1000s of genes analyzed) than menu-driven, click-based statistical software.
Factorial Analysis of VarianceGeneral setup for the tutorial
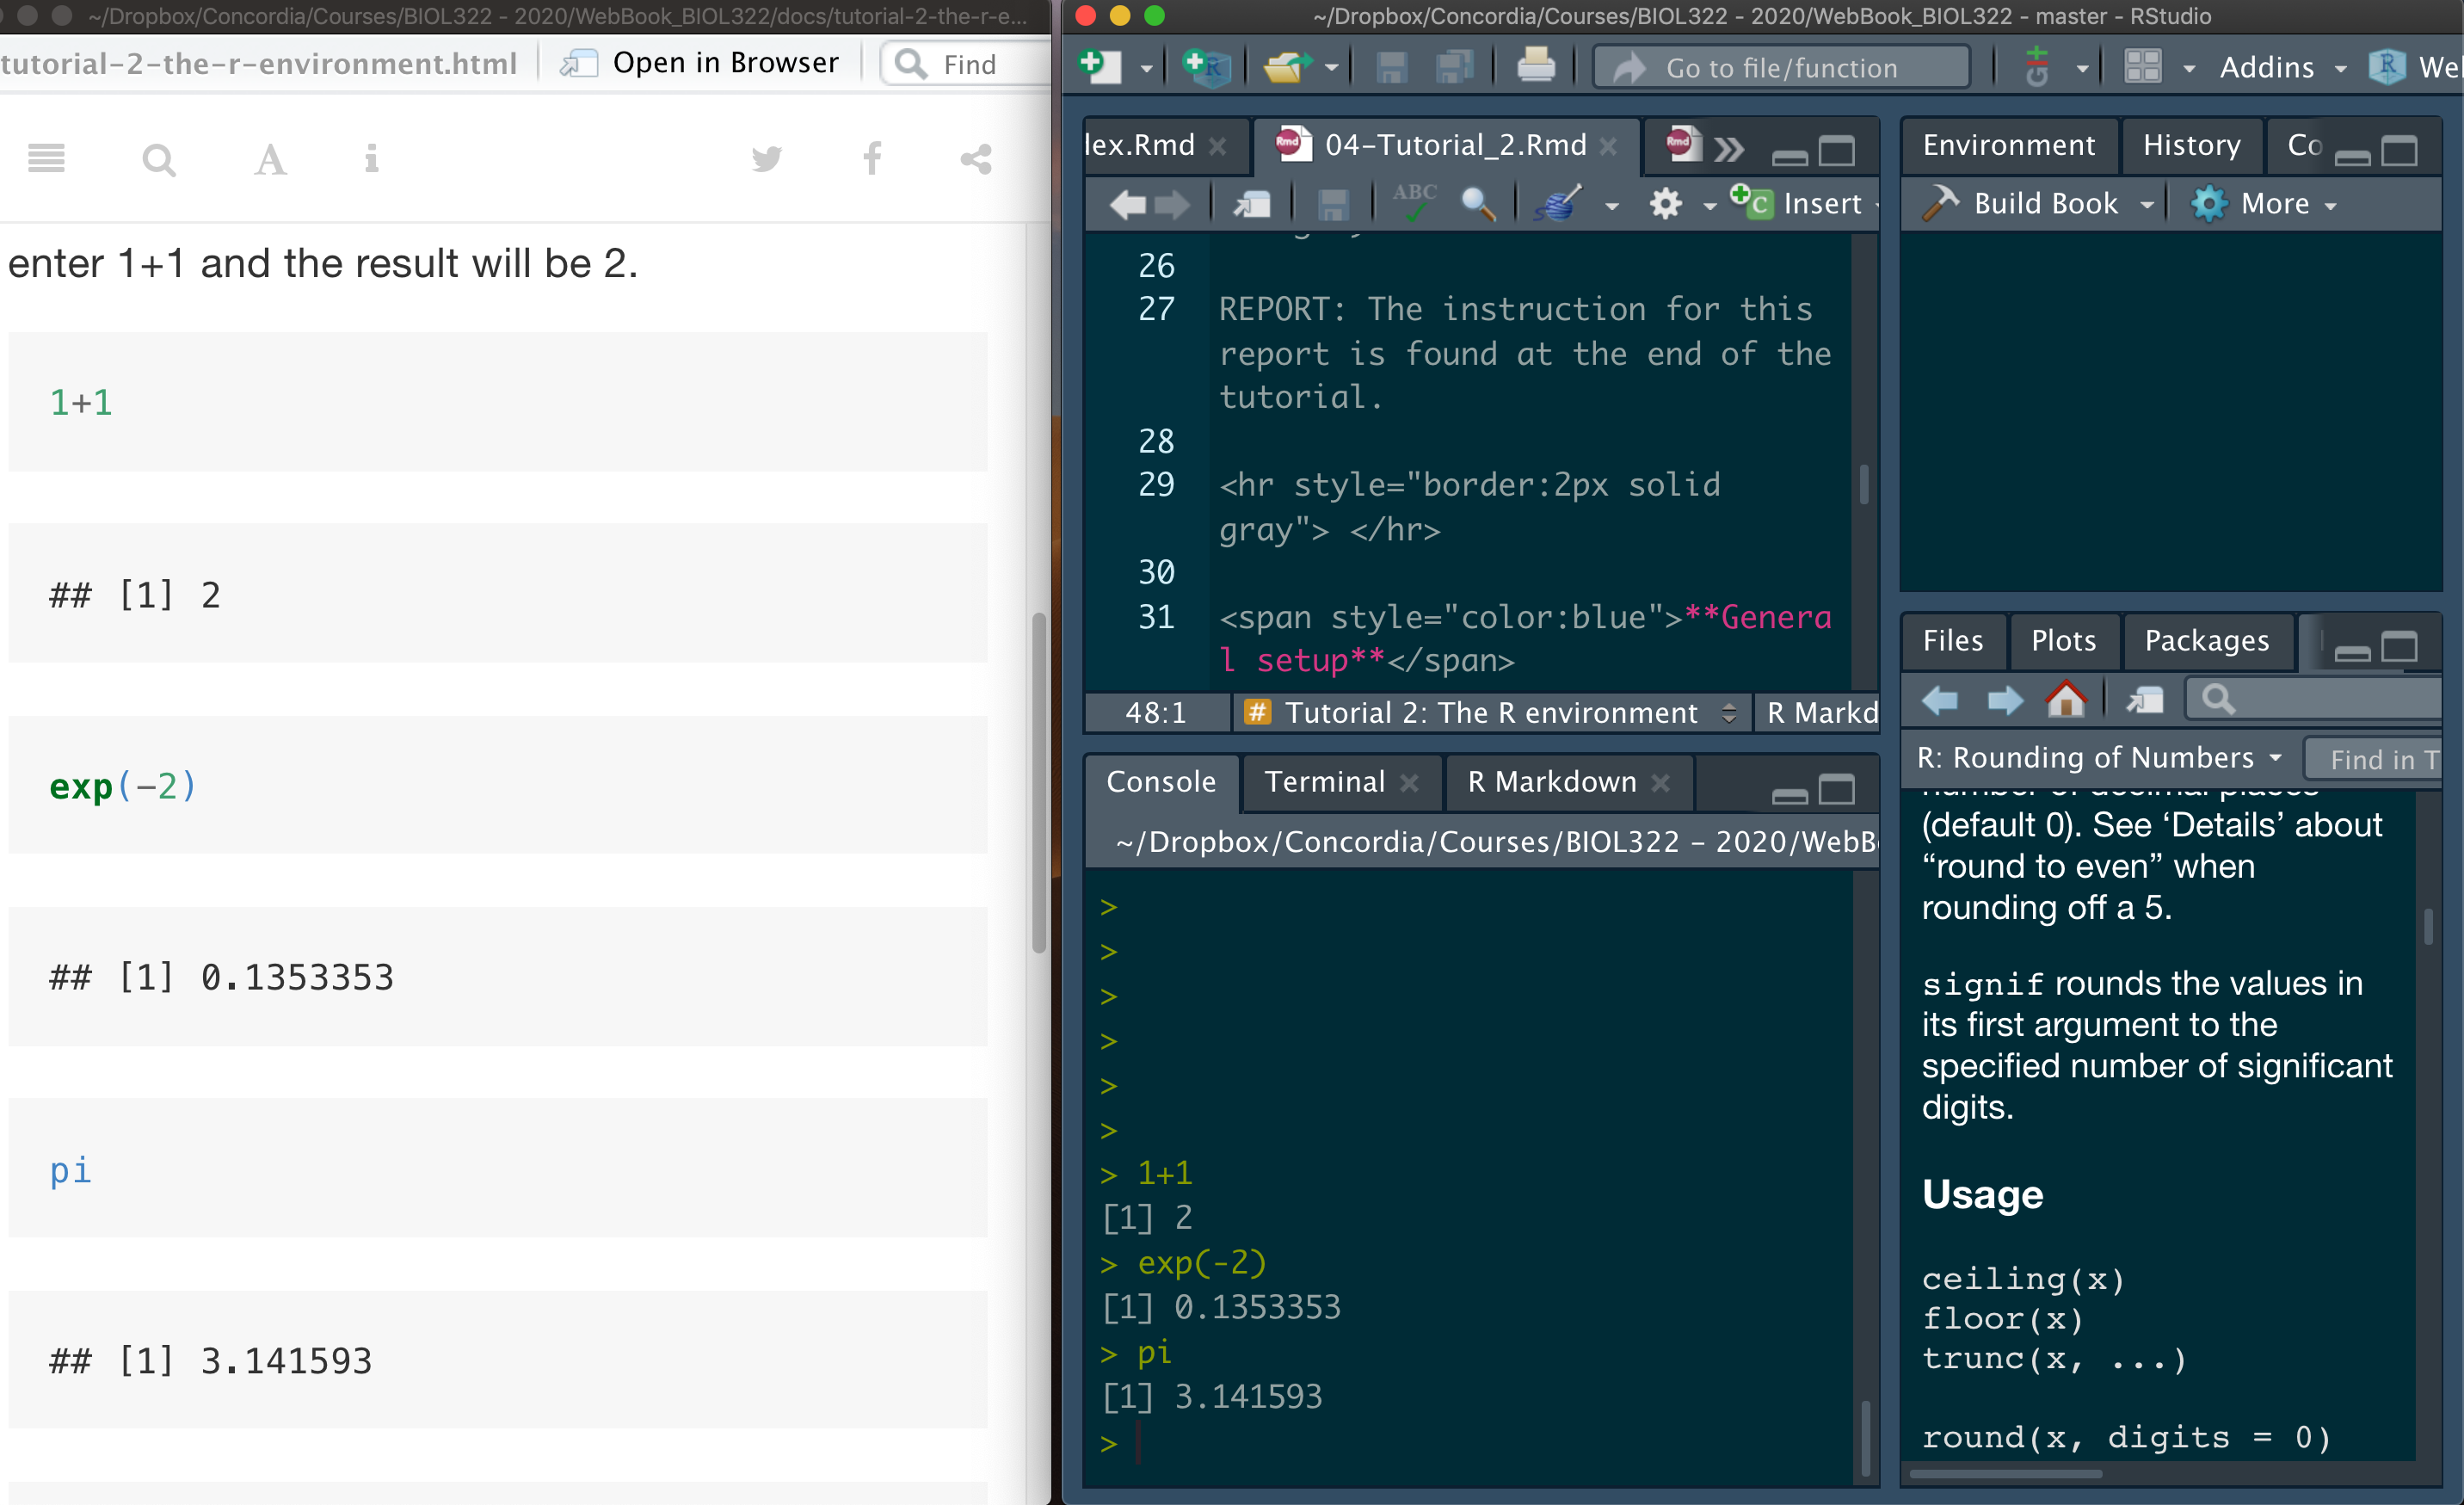
A good way to work through is to have the tutorial opened in our WebBook and RStudio opened beside each other.
NOTE: Tutorials are designed so that you can easily adapt the commands to your own data. This is exactly how R is used in practice by many statisticians and researchers.
Revisiting one-factor ANOVA
Let’s do a quick review on how to perform a one-factor ANOVA (or one-way ANOVA) in R. Here we will use the data from the “The knees who say night” problem, as seen in class; The data come from Whitlock and Schluter (2009), The Analysis of Biological Data.
Note that I usually treat data as a plural noun (data are), although it is often used in the singular as well—even though the correct singular form is datum. For the curious, here is a short discussion:
https://en.wikipedia.org/wiki/Data_(word)
Let’s load the data:
circadian <- read.csv("chap15e1KneesWhoSayNight.csv")It is important to understand how the data are structured, as this will help you learn how to structure your own datasets. The View() command allows you to inspect the data exactly as they appear in the CSV file. Importantly, it also shows the names of the variables (columns), which is useful if you have forgotten them in your own data or when working with new datasets provided by others.
View(circadian)Now, let’s conduct the ANOVA. We first save the output of the function aov (an acronym for analysis of variance) in the object result.aov.circadian. To generate the ANOVA table, use the function summary with the aov object as input:
In R, an object is simply a named container that stores something you create or compute. This “something” can be a single number, a vector of values, a table of data, or the result of a statistical analysis. By saving results as objects, you can reuse them later, inspect their contents, or apply other functions to them without having to redo the analysis.
result.aov.circardian<-aov(shift ~ treatment,data=circadian)
summary(result.aov.circardian)
Assumptions
ANOVA relies on three key assumptions that the observed data must satisfy (in statistical jargon, we say that assumptions are met or not met). These assumptions ensure that the observed F statistic is correctly estimated and that the Type I error rate of the test matches the pre-specified significance level (α). In this tutorial, we focus on the first two assumptions: homoscedasticity and normality within treatments (also referred as to groups or levels) of a factor). The third assumption—random sampling, or independence of observations—is more complex and will be discussed later in the course.
The first assumption (as introduced in Intro BioStats courses) is equality of variances among treatments (i.e., homoscedasticity). In this context, the null hypothesis H0 states that the groups or treatments come from populations with equal variances. If this H0 is rejected, a standard ANOVA is no longer appropriate.
To test this hypothesis, we can use Levene’s test. Let’s apply this test to the circadian data to determine whether the homoscedasticity assumption is met. Because base R does not include Levene’s test, we need to install an additional package called car. To do so, simply:
install.packages("car")Then simply call the package by:
library(car)We are now ready to run Levene’s test. When using the leveneTest function, it is important to explicitly specify that treatment is a factor, as the test relies on group membership. This is not required when fitting the ANOVA itself using the aov function.
In R, a factor is a special type of object used to represent categorical variables—that is, variables that define groups or categories rather than numerical values. When a variable is declared as a factor, R understands that its values represent distinct levels (e.g., treatments, groups, or categories) and should be handled differently from numerical data in statistical analyses.
Importantly, many R functions can accept the same variable either as numerical or as a factor, but they will perform different calculations depending on how that variable is defined. If the variable is numeric, the function treats it as a continuous quantity; if it’s a factor, the function treats it as categorical and bases its calculations on group membership.
leveneTest(shift ~ as.factor(treatment), data=circadian)Given that the calculated P-value is 0.8545, we do not have evidence to reject H0</sub, which states that the treatments (groups) come from populations with equal variances. Therefore, the assumption of homoscedasticity is met.
Normality: The second key assumption underlying analysis of variance (ANOVA) is normality. Specifically, this assumption states that the variable of interest (here, circadian shift) is normally distributed within each treatment (or within each combination of treatments in the case of a factorial ANOVA).
This assumption is typically assessed by examining whether the ANOVA residuals fall (approximately) along a straight line when compared to what would be expected under a normal distribution. This is commonly done using a Q–Q plot.
If you do not remember Q–Q plots, or if they were not covered in your Intro Stats course (they were covered in BIOL 322), watch the following excellent video:
Q–Q plots explained (YouTube video)
For that, we use the widely used Q-Q plot (quantile-quantile plot):
plot(result.aov.circardian, which=2)Note: Plotting an ANOVA object produces several diagnostic plots, which can be selected using the which argument in the plot() function. The residual Q–Q plot corresponds to the second diagnostic plot.
In this case, most residuals fall close to a straight line, so we assume that the data come from normally distributed populations. Keep in mind, however, that ANOVA is generally robust to moderate departures from normality. That’s right, we use terms such as departure from normality in statistics.
Two-factorial ANOVA
Here, we use a few examples to illustrate the different possible outcomes of a two-factor ANOVA, including main effects and interactions.
Example 1: We will start by the fictional example covered in lecture 4 regarding the effects of exercise and diet on weight loss.
Download the diet fictional data
Let’s load the data:
diet.data <- read.csv("DietExerciseA.csv")Let’s examine how the data are structured. This step is especially important when working with your own data, as it helps you understand how datasets should be organized in a CSV file:
View(diet.data)Let’s conduct the ANOVA:
result.aov.diet <- aov(WeightLoss ~ factor(Diet) * factor(Exercise), data=diet.data)
summary(result.aov.diet)
Take a look at the results!
One important thing you will learn is that there are often multiple ways to run the same analysis in R. For example, ANOVAs can also be performed using the function lm, which fits linear models (hence the name lm). The lm function is very flexible and can be used for many types of analyses beyond ANOVA, so it is worth becoming familiar with it. Note that the results obtained with lm are identical to those produced by the aov function.
result.ANOVA.lm <- lm(WeightLoss ~ Diet * Exercise, data=diet.data)
anova(result.ANOVA.lm)
Let’s use the function aggregate to calculate the mean and the variance per combination of exercise and diet:
aggregate(WeightLoss ~ Diet * Exercise, FUN=mean,data=diet.data)
aggregate(WeightLoss ~ Diet * Exercise, FUN=var,data=diet.data)
Let’s verify if the assumptions are met. First, homoscedasticity (i.e., if treatment combinations come from populations with the same variance):
leveneTest(WeightLoss ~ factor(Diet) * factor(Exercise), data=diet.data)Given that the P-value is 0.2044 (i.e., sufficiently large), we do not have evidence to reject H0, which states that the treatments (groups) come from populations with equal variances. Therefore, the assumption of homoscedasticity is considered to be met.
Next, let’s assess normality:
plot(result.aov.diet, which=2)Most of the residuals fall close to a straight line, so we assume that the data come from normally distributed populations—that is, the statistical populations from which observations within each combination of treatments (or groups) are drawn are approximately normal.
The next usual step in a two-way ANOVA is to examine interaction plots, which help us understand how the means vary across combinations of treatments (e.g., how different combinations of diet and exercise compare).
We can also use the powerful package ggplot2 to produce plots. To simplify the coding, we will rely on a few additional packages. The package tidyverse is designed to support data science workflows and provides tools for efficient data manipulation and well-structured data handling; it also includes ggplot2. As a result, installing tidyverse automatically installs ggplot2. That said, it is useful to know that ggplot2 is also a standalone package and can be installed and used independently. The package psych will be used to calculate standard errors for group means.
Let’s install them:
install.packages("ggplot2")
install.packages("tidyverse")
install.packages("psych")
NOTE for macOS Big Sur users (M1 chips) - You will to push the installation package dependencies (i.e., install the packages of which the package of interest depends on) as follows: install.packages(“package name”, dependencies = TRUE) as follows:
install.packages("ggplot2",  dependencies = TRUE)
install.packages("tidyverse", dependencies = TRUE)
install.packages("psych", dependencies = TRUE)
Let’s load them:
library(ggplot2)
library(tidyverse)
library(psych)
A good additional resource for two-factorial anova plots can be found here: https://philippmasur.de/2018/11/26/visualizing-interaction-effects/
Let’s start by summarizing the data. Note that tidyverse and other packages use the operator %>% which are called pipes; the original of this operator comes from the package magrittr and is now widely used in many R packages to simplify data manipulation.
The pipe operator %>% passes the data from one function directly into the next, avoiding the need to create intermediate objects. In the example below, diet.data (our dataset) is first passed to group_by(), which tells R how to organize the data into groups based on Diet and Exercise. The grouped data are then passed to summarise(), which computes summary values for each group, such as the mean. Inside summarise(), we use functions from the psych package to calculate standard errors (se) for those group means.
This “pipeline” style is an efficient and readable way to structure analyses in R, but it can take a bit of time to get used to. In practice, many users learn to adapt working code to new datasets before they fully understand every function call—and that’s fine, as long as you can explain the key steps and verify the output makes sense.
data.summary <- diet.data %>% group_by(Diet,Exercise) %>%
  summarise(y_mean = mean(WeightLoss),
            y_se = psych::describe(WeightLoss)$se)
data.summary
Now we can produce the plot (ggplot). It also takes a while to get used to the ggplot “grammar” and, again, adapting the code is the best way to start getting use to it. The package has a lot of functions for graphic and plot manipulation. In ggplot we use the symbol + to add elements to the plot. Note that the data.summary produce just above is passed to the function ggplot:
data.summary %>%
      ggplot(aes(x = Diet, y = y_mean, color = Exercise)) +
      geom_line(aes(group = Exercise)) +
      geom_point() +
      geom_errorbar(aes(ymin = y_mean-1.96*y_se,
                    ymax = y_mean+1.96*y_se),
                    width = .1) +
      labs(x = "diet",color  = "exercise", y = "Weight loss") +
      theme_classic()
The error bars around the mean values represent 95% confidence intervals. Instead of multiplying the standard error by the appropriate t-value for each sample size, I used 1.96 × the standard error as a normal‐approximation to the 95% interval. The value 1.96 comes from the standard normal distribution, which contains about 95% of values within ±1.96 standard deviations of the mean. This simplification keeps the focus on interpreting the graph rather than on sample-size–specific calculations based on the t-distribution instead of the normal distribution.
As I said in one of the lectures; I could spend between 10 minutes and 10 hours producing the same graph depending on how detailed and stylistic I want the graph to appear. Even then, sometimes we give up on trying to find the “perfect” way to make a graph look really great and end up resorting using another software. I sometimes use InkScape (https://inkscape.org/en/) which is freely available for Linux, Mac and Windows! Or, as some people do (no me :), you can also export into pdf and then use powerpoint to change certain aspects of the graph aesthetics.
Example 2: Here we will use data on normalized change in gene expression for 1000 genes on two (2) mice strains and six (6) brain region; each region within each mouse has two (2) replicates as seen in class; i.e., total of 24 (2 x 6 x 2) rows in the file; genes are in columns.
In this example, we are interested whether change in gene expression (response variable) differs among two factors: mice strain and brain region. However, here we have 1000 genes, so that we could potentially run 1000 ANOVAs.
Download the Sandberg gene data
Let’s upload the data:
gene.Sandberg <- read.csv("SandbergGeneData.csv")Let’s look at the data. The brain regions are coded to make it shorter as “ag” (Amygdala), “cb” (Cerebellum), “cx” (Cortex), “ec” (EntorhinalCortex), “hp” (Hippocampus) and “mb” (Midbrain). X129 and B6 refer to different mouse strains (and yes—the naming conventions can seem a bit mysterious). If you are curious about how mouse strains are defined and named, have a look here: https://en.wikipedia.org/wiki/Laboratory_mouse.
View(gene.Sandberg)Let’s conduct a two-way ANOVA for the first gene, i.e., the first column in the data (aa000148.s.at):
result.ANOVA.gene <- lm(aa000148.s.at ~ strain * brain.region, data=gene.Sandberg)
anova(result.ANOVA.gene)
Both main effects and their interactions are not significant.
We can certainly run all the same analyses performed earlier for the Exercise example (e.g., Levene’s test, normality checks, interaction plots). However, in gene expression studies we are often interested in “bulk” analyses, such as identifying genes for which differences are associated only with strain, only with brain region, or for which the interaction between these factors is significant.
To do this, we need to run 1,000 two-way ANOVAs, one for each gene. This type of analysis clearly illustrates the power of R as a statistical environment. Imagine trying to do this using menu-driven statistical software—clicking through the same steps 1,000 times, one gene at a time!
There are different ways in which we can run a bulk two-way ANOVA for multiple responses (here genes). Here we will use one of them that is not too complex to understand and at the same time very efficient.
The first thing we will do is to create a vector containing the names of all genes. These are response variables so we will be calling the vector responseList but any other name of your choosing would work:
responseList <- colnames(gene.Sandberg)[3:length(gene.Sandberg)]We will then use the function lapply to apply a function that we will write that will allow us to run the multiple ANOVAs. To make it general, we will create a formula that goes in the function lm (linear model). I called that formula my.formula, but any name would work as well. ANOVAs are linear models (we will see that later in the course) and we can use the function lm to run the model; and then conduct an ANOVA on the results of the linear model:
modelList <- lapply(responseList, function(resp) {
  my.formula  <- formula(paste(resp, " ~ strain*brain.region"))
  lm(my.formula, data = gene.Sandberg)
})
It should take less than 30 seconds to run 1000 ANOVAs, one for each gene. The code creates a list, which I called modelList. Objects in lists are assigned as “[[number]]” and not simply as “[number]”, which is used for assigning cells in vectors and matrices. Let’t take a look into the model for the fifth gene:
modelList[[5]]We could also run the ANOVA for this gene as follows:
anova(modelList[[5]])Let’s now run an anova for all genes by simply using lapply again:
ANOVA.genes <- lapply(modelList, anova)Another few seconds and done! 1000 ANOVAs! Wow!
We can extract the ANOVA results for any individual gene. For example, let’s look at gene 145:
ANOVA.genes[[145]]Now, take a look in the list of ANOVA results:
ANOVA.genesAll 1000 ANOVA results are in the list ANOVA.genes. Now, let’s say that we want to identify all the genes for which change in gene expression only differed between strains. For that, we need to isolate from the ANOVA table the probabilities for the two main factors (strain and brain.region) as well as for their interaction. The first thing to learn is that all the information kept in an object (here ANOVA table) can be found by using the function names:
names(ANOVA.genes[[1]])In this output, you will find "Pr(>F)", which corresponds to the P-values we are interested in. Note that these P-values are located in the fifth column of the ANOVA table.
We can therefore extract the three P-values—those associated with the two main effects (strain and brain.region) and with their interaction—as follows:
ANOVA.genes[[1]][1:3,5]When you look at the table, we know that the 1st probability refers to strain, the 2nd to brain.region and the third to their interaction.
Now we need to get all the p-values from all the 1000 ANOVA objects in the list. This can be done as follows:
P.values <- sapply(ANOVA.genes, function(x) {x[1:3,5]})
dim(P.values)
Again, this code may seem a bit “cryptic” at first, but it can be easily adapted to your own data. With time and practice, the logic behind functions and commands in R becomes much more intuitive.
It is also worth emphasizing that most practitioners do not write code from scratch: they adapt existing code or search online for solutions to specific problems. R has a very large and active user community, with countless blogs and forums where questions can be asked—and they are often answered very quickly. In fact, R is used by millions of people worldwide.
P.values is a matrix with 3 rows (the two main effects and their interaction) and 1,000 columns (one per gene).
Let’s assign names to the rows and columns of this matrix. Doing so will make it much easier to identify which genes and which effects (main effects or interaction) are statistically significant, as we will see below. The genes appear in the same order in which they were analyzed and are stored in the vector responseList, which we created earlier.
rownames(P.values) <- c("strain","brain.region","interaction")
colnames(P.values) <- responseList
Let’s take a look into the P.values matrix:
View(P.values)Note that only the first 50 genes are shown and you can move with the arrows above to view the other genes.
Now, let’s identify which genes differ in their change in gene expression regarding only the strain, considering a significant level (alpha) equal to 0.05.
The function which allows us to determine the rows in the matrix P.values that follow particular conditions. Let’s find the genes for which only strain is significant (i.e., but not brain.region and the interaction):
genes.strain.only <- which(P.values["strain",] <= 0.05 & P.values["brain.region",] > 0.05 & P.values["interaction",] > 0.05)
genes.strain.only
The results come with the columns names of the matrix P.values. To list just the names of the genes:
names(genes.strain.only)Let’s find the genes for which only the interaction was significant:
genes.interaction.only <- which(P.values["strain",] > 0.05 & P.values["brain.region",] > 0.05 & P.values["interaction",] < 0.05)
names(genes.interaction.only)
You can certainly modify the code to determine other combinations of effects (e.g., only brain.region significant). You can also modify the code to test for whether the ANOVA assumptions are met for each gene or only the genes of interest (e.g., the ones that rejected the H0 for the desired conditions).
We can also generate interaction plots for any gene of interest. Let’s consider the first gene for which only the interaction was significant:
gene.of.interest <- names(genes.interaction.only[1])
gene.of.interest
The change in gene expression values for this gene are:
gene.Sandberg[gene.of.interest]Because we are working with a large number of genes, the easiest approach is to create a matrix that combines the grouping variables (contained in the first two columns of the full data matrix gene.Sandberg) with the corresponding gene expression values.
data.gene <- cbind(gene.Sandberg[,1:2],gene.Sandberg[gene.of.interest])
View(data.gene)
Now, we can easily adapt the code we learned earlier applied to the fictional diet study to the gene data:
data.summary <- data.gene %>% group_by(strain,brain.region) %>%
  summarise(y_mean = mean(aa014563.s.at),
            y_se = psych::describe(aa014563.s.at)$se)
data.summary
We can decide whether we want brain.region or strain in the horizontal axis; and the other as lines. Because we have six brain regions and only two strains, let’s use the former
data.summary %>%
      ggplot(aes(x = brain.region, y = y_mean, color = strain)) +
      geom_line(aes(group = strain)) +
      geom_point() +
      geom_errorbar(aes(ymin = y_mean-1.96*y_se,
                    ymax = y_mean+1.96*y_se),
                    width = .1) +
      labs(x = "brain region",color  = "strain", y = "Normalized change in gene expression") +
      theme_classic()
One may find the error bars very distracting; we can simply remove it and re-plot as follows:
data.summary %>%
      ggplot(aes(x = brain.region, y = y_mean, color = strain)) +
      geom_line(aes(group = strain)) +
      geom_point() +
        labs(x = "brain region",color  = "strain", y = "Normalized change in gene expression") +
      theme_classic()
After the lectures and this tutorial, we hope that you have:
1.  Understood how data are structured for a two-way ANOVA.
2.  Learned how to interpret the results of a two-way ANOVA.
3.  Learned how to test the assumptions of ANOVA, including multi-factorial ANOVAs (two-way and beyond).
4.  Begun to understand how to set up analyses to identify patterns in bulk analyses involving multiple response variables.
5.  Improved your overall R skills.
6.  Become familiar with the ggplot2 environment, a widely used package for data visualization that we will use throughout the course.
7.  Recognized why a language-driven statistical environment offers greater flexibility, reproducibility, and scalability (1000s of genes analyzed) than menu-driven, click-based statistical software.